The date at a glance.
Conversions between different currencies show the dates of the observations used.

Convert USD/JPY, look up historical rates and understand the rate direction.

For guidance: reference rates are not binding buy or sell prices. Your bank's fees, markups and actual exchange terms are not included.
The table uses the same reference rates and direction as the converter above. Fees excluded.
| Source amount | Equivalent amount |
|---|---|
| Loading rates … | |
Choose a pair for the chart and historical conversion.
| Date | Target currency rate per 1 unit |
|---|
Daily reference rates. The line connects available observations; no rates are invented for days without publication. The vertical axis shows the range of values and does not necessarily start at zero. Past rate movements do not provide reliable predictions.
Equivalent of 1 USD
| Currency | Reference rate | Rate date | Converter |
|---|---|---|---|
| Loading rate data … | |||
USD/JPY shows how many Japanese yen equal one US dollar. The large number reflects the different currency units and says nothing by itself about an economy's strength.
This rate is calculated from the two euro reference rates: yen per euro divided by dollars per euro gives yen per dollar. The chart uses only observations from the same day.
For dollar amounts intended for spending in Japan, calculate the yen equivalent. Yen results are shown without decimal places; the internal calculation retains greater precision. Actual exchange costs may apply in addition.
The chart shows published reference rates within the selected period. Weekends, holidays or missing data can make its start and end differ from the requested period. The change compares the first and last observations actually displayed. It is not the return on a financial product.
Use the historical converter for a specific date. It shows both your requested date and the rate date used. A bank statement from that time may differ because of fees or a different settlement time.
No. The displayed values serve as a reference. Your actual target amount depends on your provider's rate and fees. Always compare offers using the same source amount and total charge.
The percentage compares the last available daily value with the first in the selected period. It is neither an average nor a forecast. High and low refer to the available reference observations.
The arrow swaps the currencies in the current converter. For the chart and historical conversion, choose the direction using their separate selection fields.
Understand the conversion formula · Understanding historical rates · Compare total costs
Conversions between different currencies show the dates of the observations used.
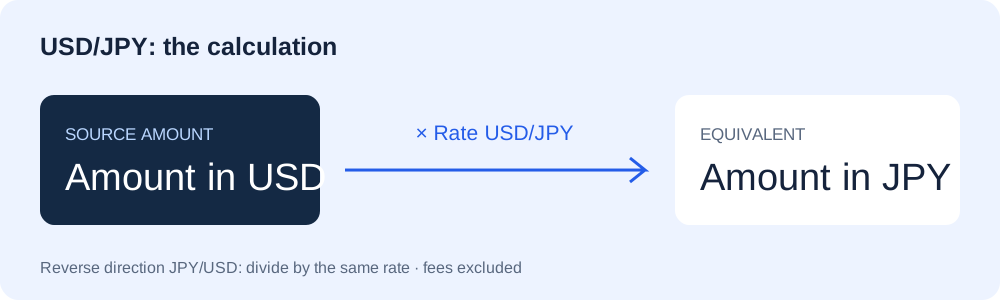
Amount times exchange rate gives the equivalent value. For two other currencies, the ratio of their euro rates is calculated.
New reference rates appear on publication days. At weekends and on other days without publication, the latest available rate remains the reference.
Why does the bank's rate differ? What does the reciprocal mean? How are two currencies compared? Our explanations help you interpret the numbers.