
Reading rate charts: periods, axes and changes
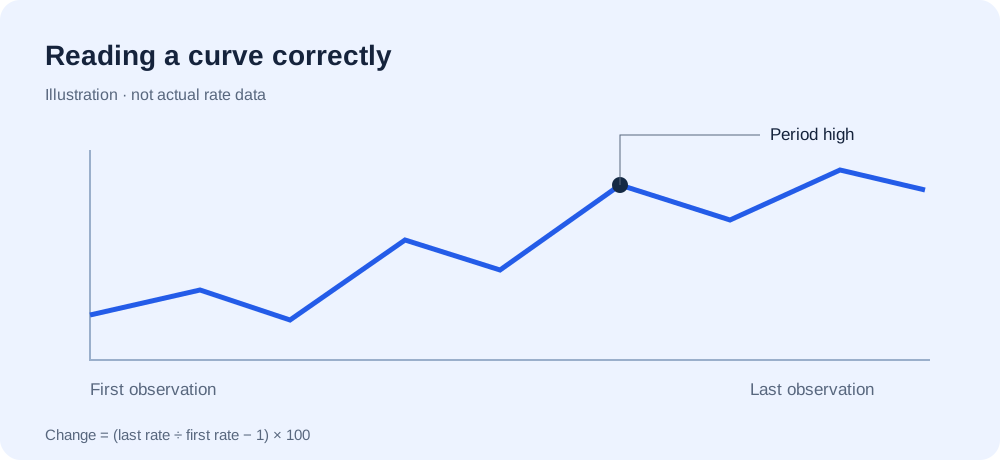
Learn to read currency charts: rate direction, time axis, highs and lows, and the limits of percentage changes.
First check the rate direction
A rising EUR/USD chart means that one euro is worth more US dollars in the calculation. It does not mean both currencies have strengthened simultaneously. Someone holding dollars who wants to buy euros must view the same move in reverse. Before interpreting a chart, read the indication “1 source currency in target currency”.
What the two axes show
The horizontal axis orders observations by date; the vertical axis shows the rate. Our vertical scale adjusts to the displayed range and does not necessarily start at zero. This makes smaller movements visible but may amplify their visual effect. Compare the numbers, not just line steepness across charts with different scales.
Choose the period deliberately
A month shows a shorter slice than a year or five years. A move that looks pronounced on a monthly chart may be a small fluctuation over a longer period. The actual start and end dates appear above the chart. Missing publication days may make them differ from the requested start and end.
Distinguish high, low and change
High and low are the largest and smallest available daily values in the selected period. They are not guaranteed executable daily high or low prices. Percentage change is calculated as: (last rate ÷ first rate − 1) × 100. A hypothetical rise from 1.00 to 1.10 is 10%. A fall from 1.10 to 1.00, however, is approximately 9.09%.
Do not read the line as a forecast
Lines connect existing observations. They do not create extra data for days without publication. The expandable table lists the values actually used. A past rate change is neither a reliable guide to the next move nor automatically an investment return. Fees, entry and exit times and your own reference currency would also affect such a result.
Understand the calculation
The numerical examples are hypothetical. How the converter works explains the calculation and its limits.